gif gif

The interesting corner

gif gif

Audio Filters

chorus effect filter
active filter
active high pass filter
high pass filter
RC filter
active low pass filter
butterworth filter
second order butterworth low pass filter
lowpass filter
butterworth filter
passive high pass filter
x
audio gif audio gif

Filters

There are two types of filters, Active and Passive filters. Passive filters are made of only passive components and don't require an op-amp like active filters. (source)

Response curves are used to describe how a filter behaves. A response curve is simply a graph showing an attenuation ratio (VOUT / VIN) versus frequency. Below are the graphs of a few common filters.

response curve

I made some analog filters using electronics. That post can be found in the navigation bar on the left or here.

The library also contains a report and a presentation about these subjects (both in Dutch).

speaker gif speaker gif

Low-Pass filter


(from wikipedia) A low-pass filter is a filter that passes signals with a frequency lower than a a selected cutoff frequency. Some low-pass filters also attenuate signals with frequencies higher than the cutoff frequency.

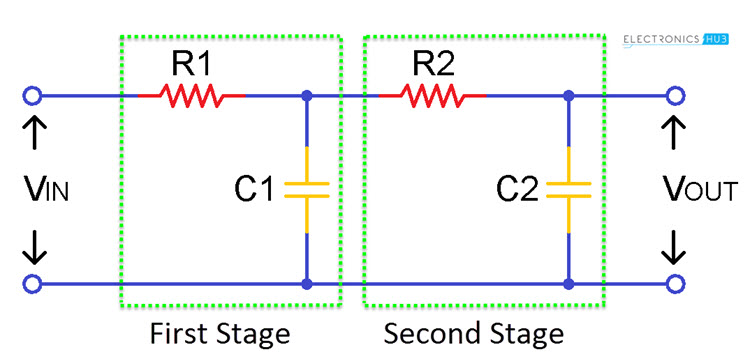
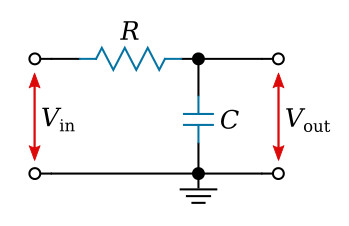
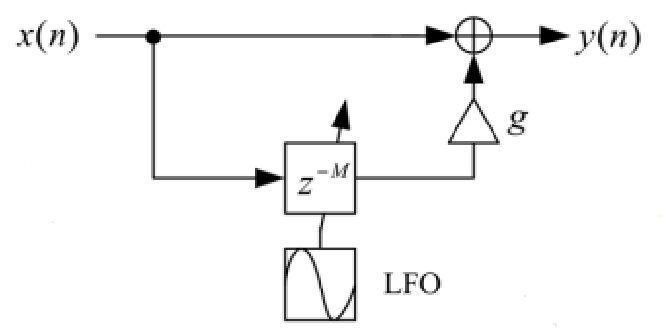
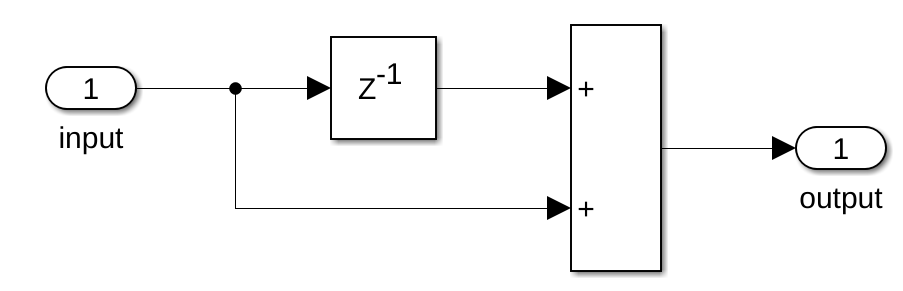
As stated in this simplest lowpass filter article, the most simple lowpass filter has the form y[n] = x[n] + x[n-1]. It's model looks like this:

simple low pass filter model

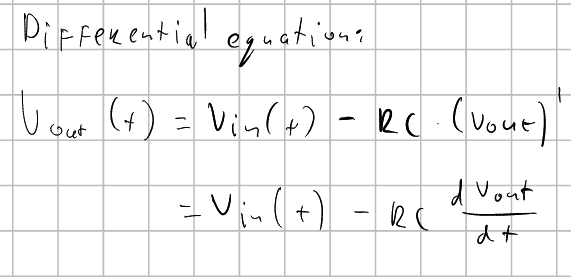
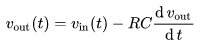
The differential equation of a low-pass filter can be described as:

differential equation for a low-pass filter

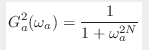
The step input response has the solution:

step input response function

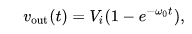
In this function, w0 = 1/RC is the cutoff frequency of the filter.

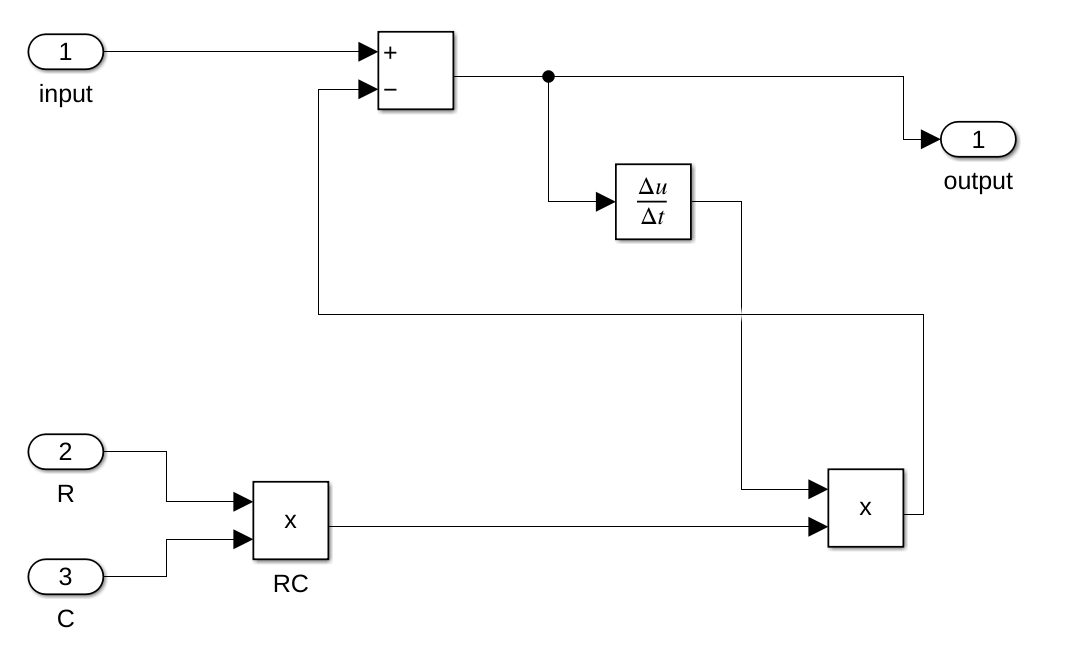
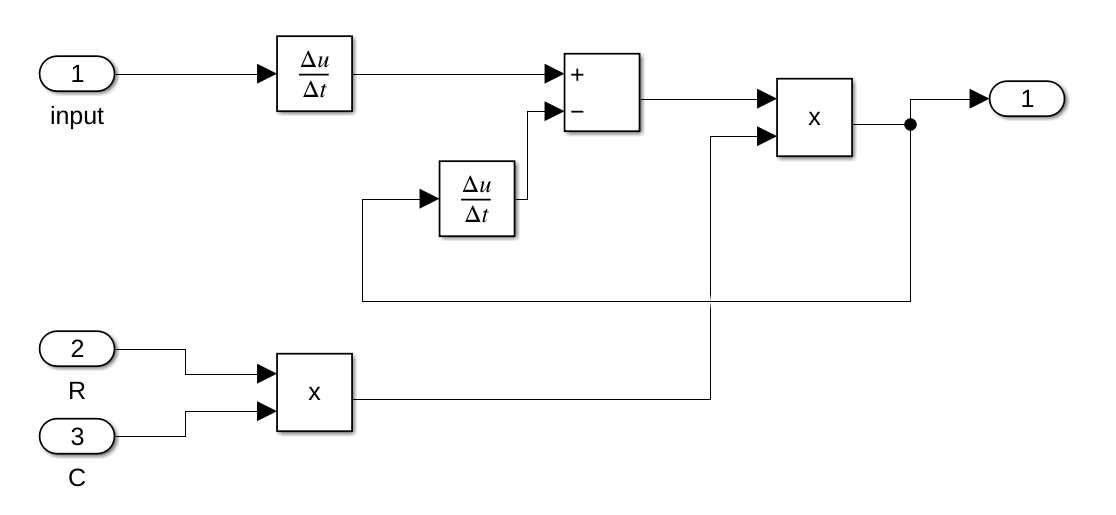
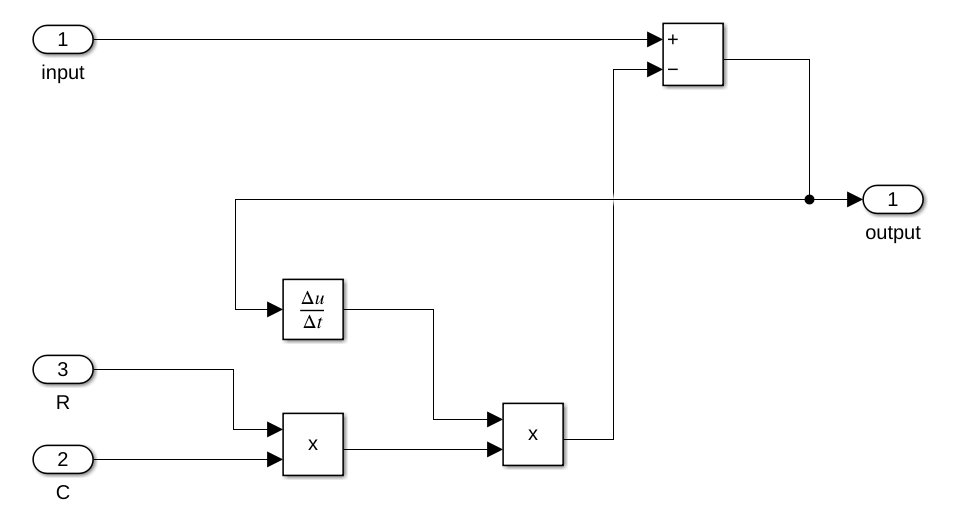
If we put the differential equation into Simulink, we get the following model:

differential equation in simulink

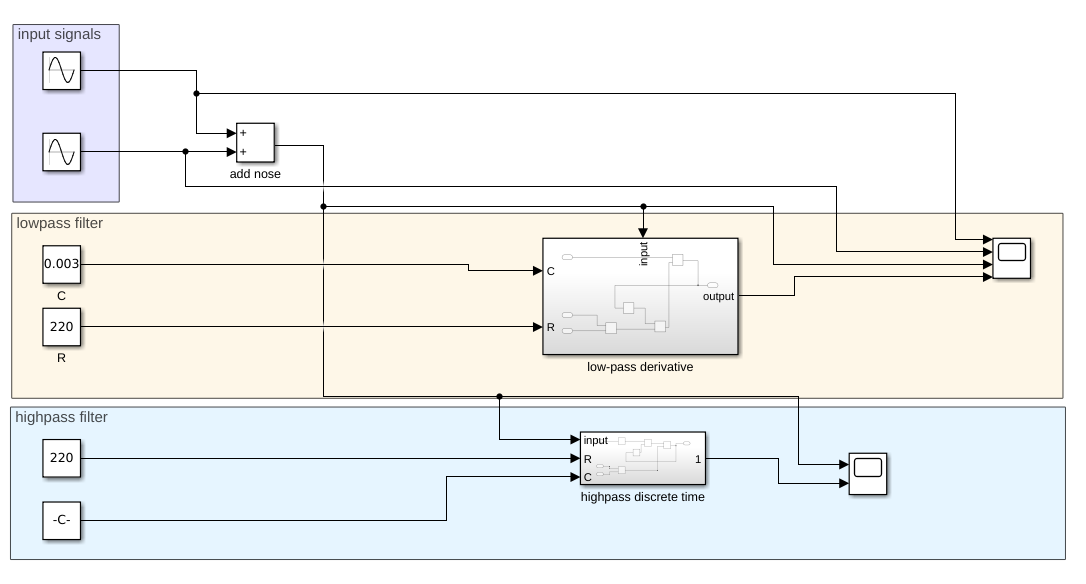
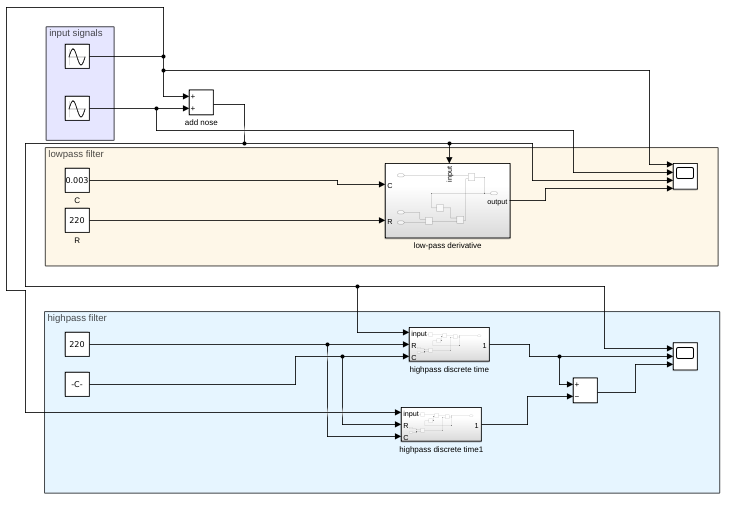
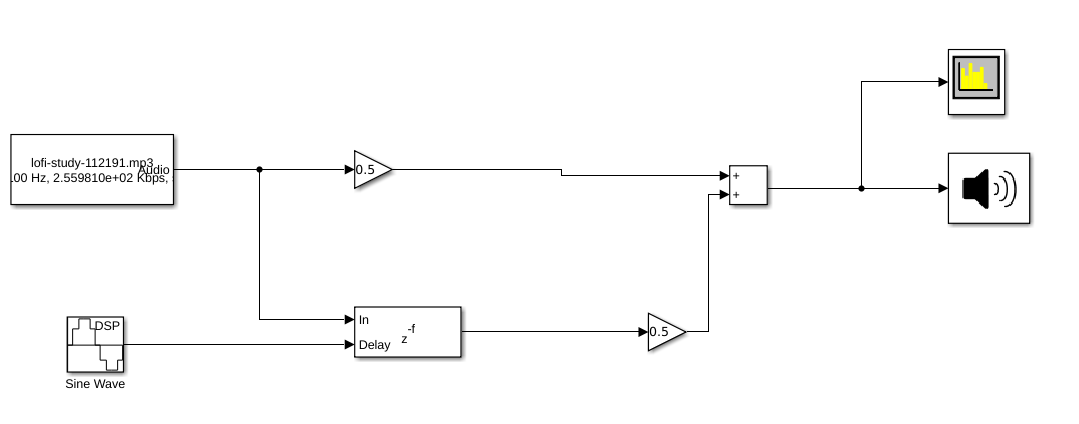
Putting this subsystem into a model with input signals, the following model can be made:

simulink model of low pass filter with frequencies

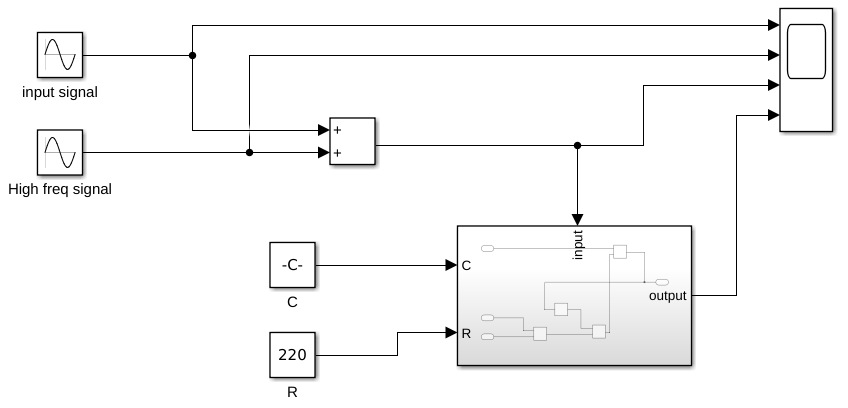
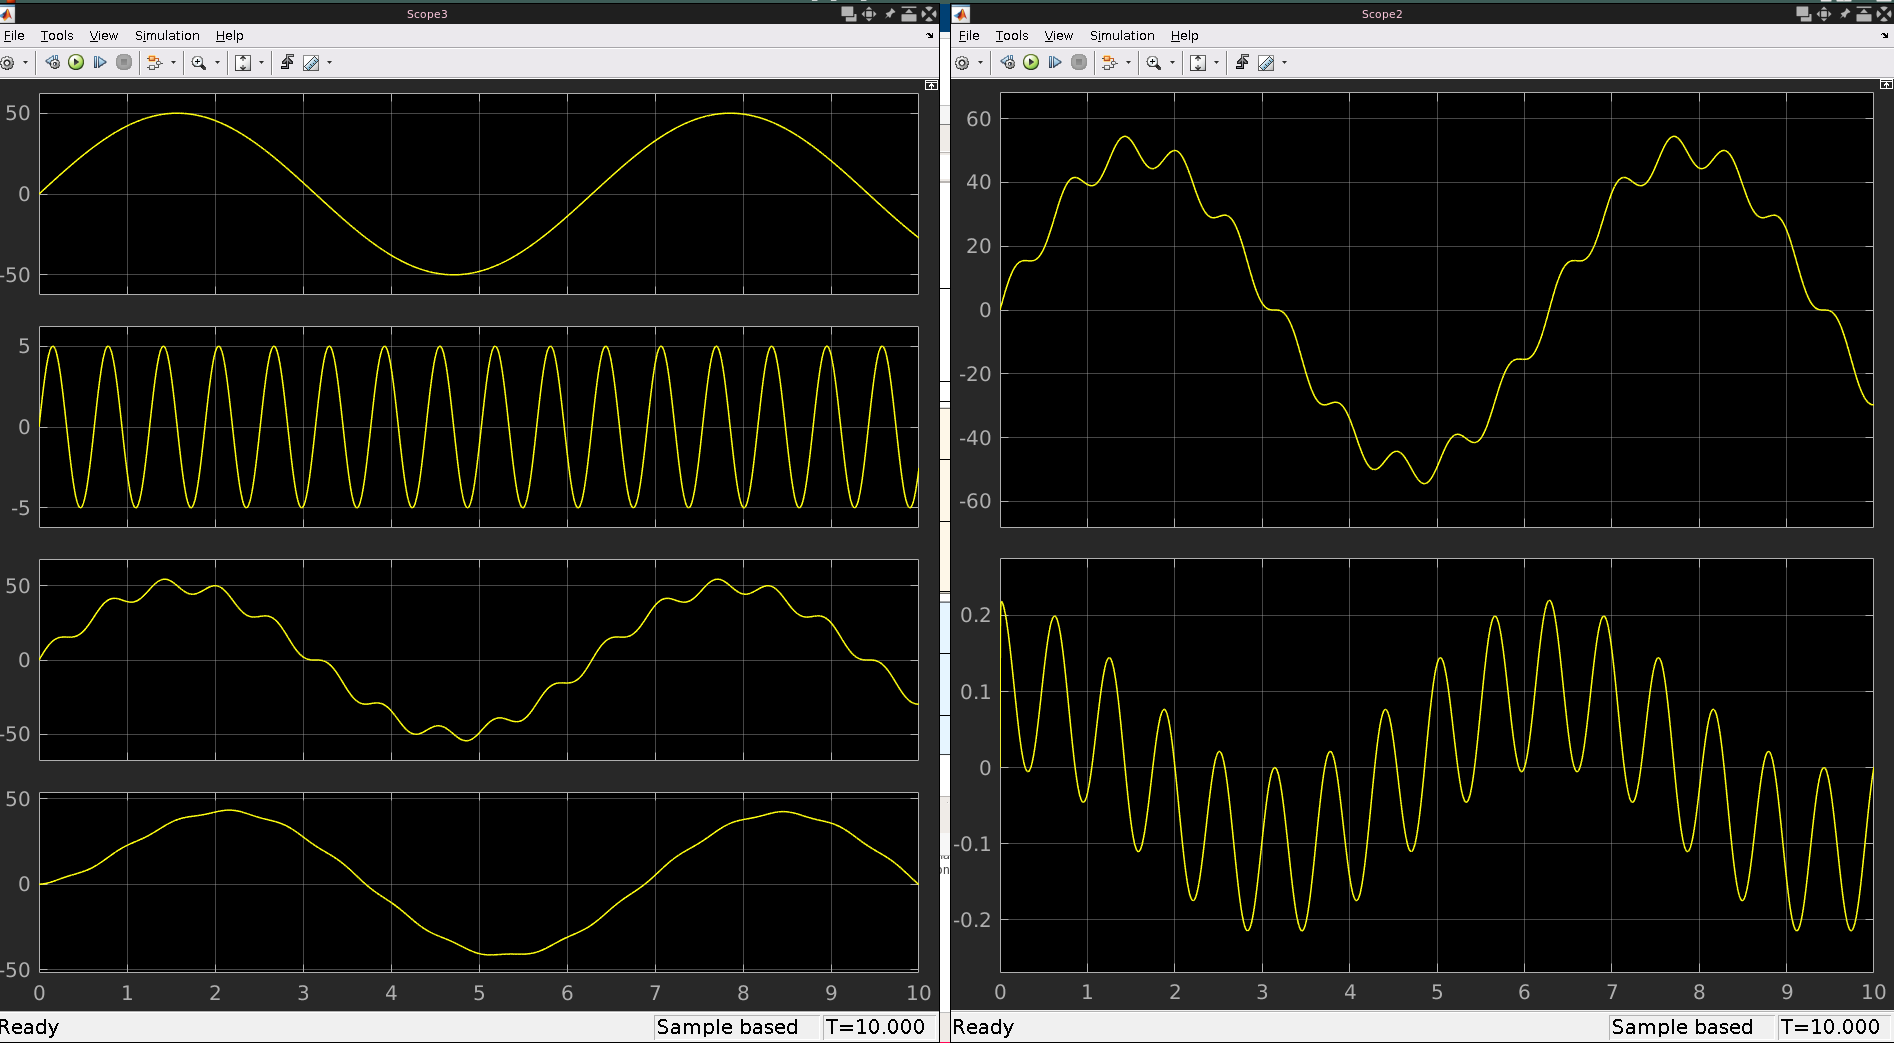
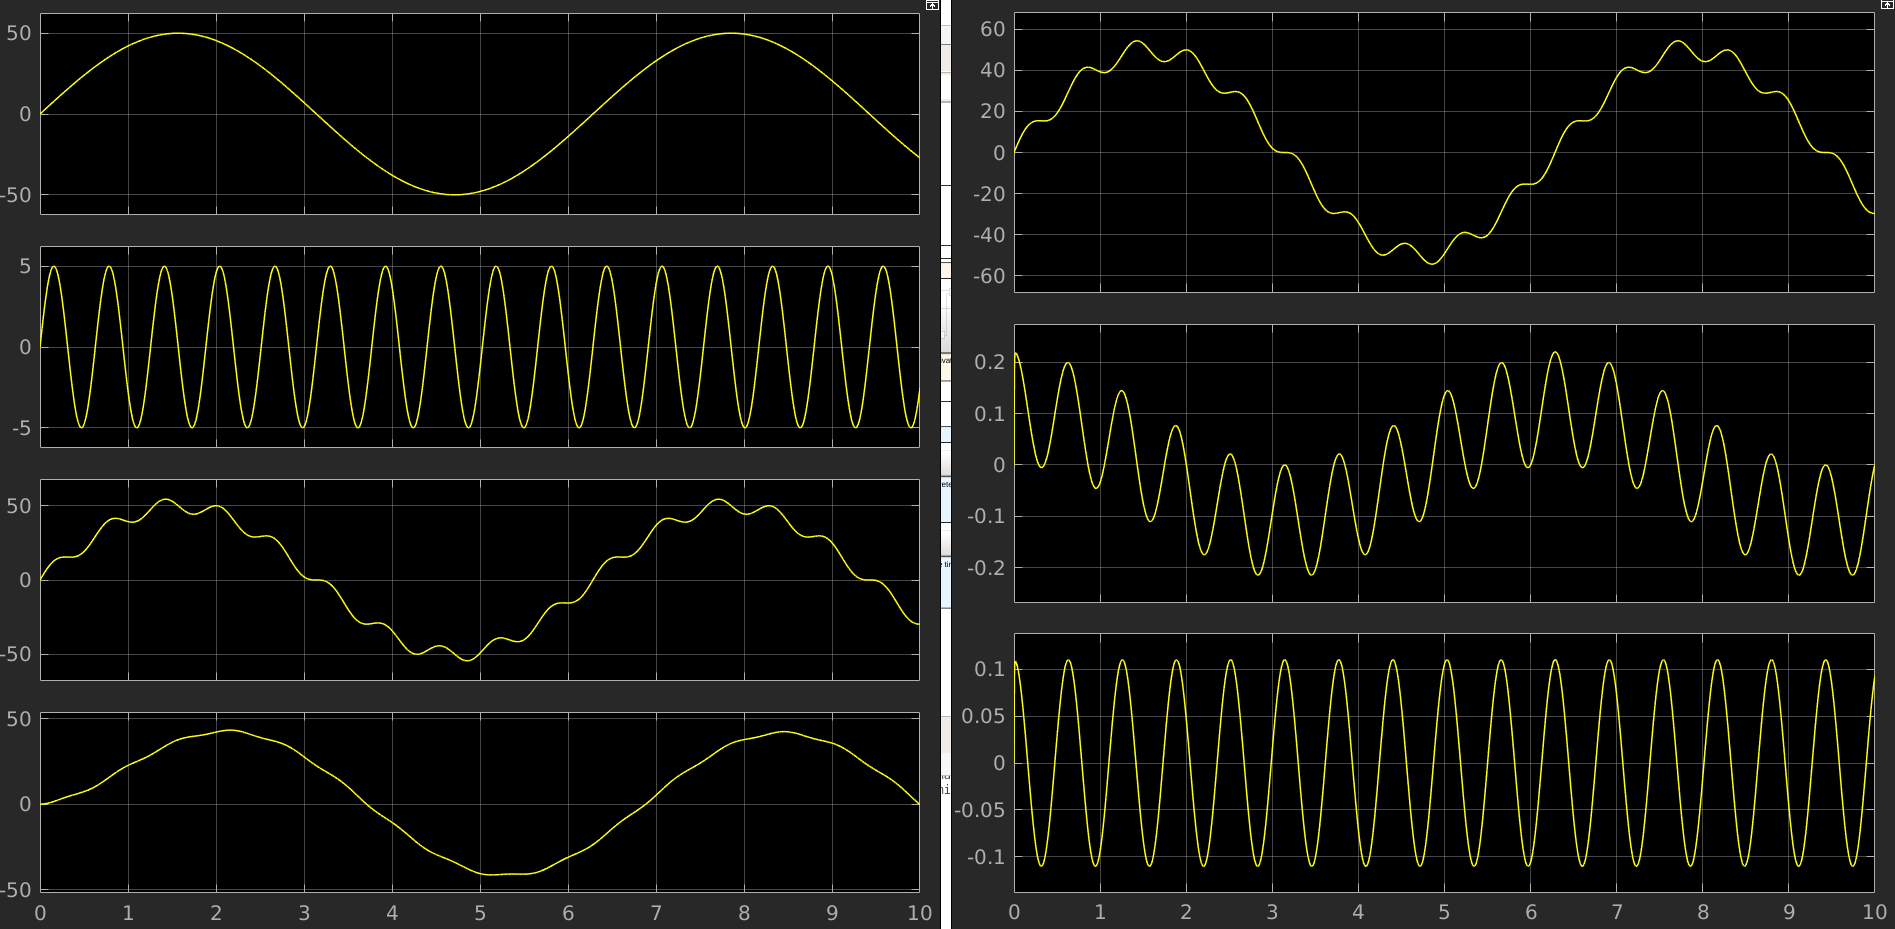
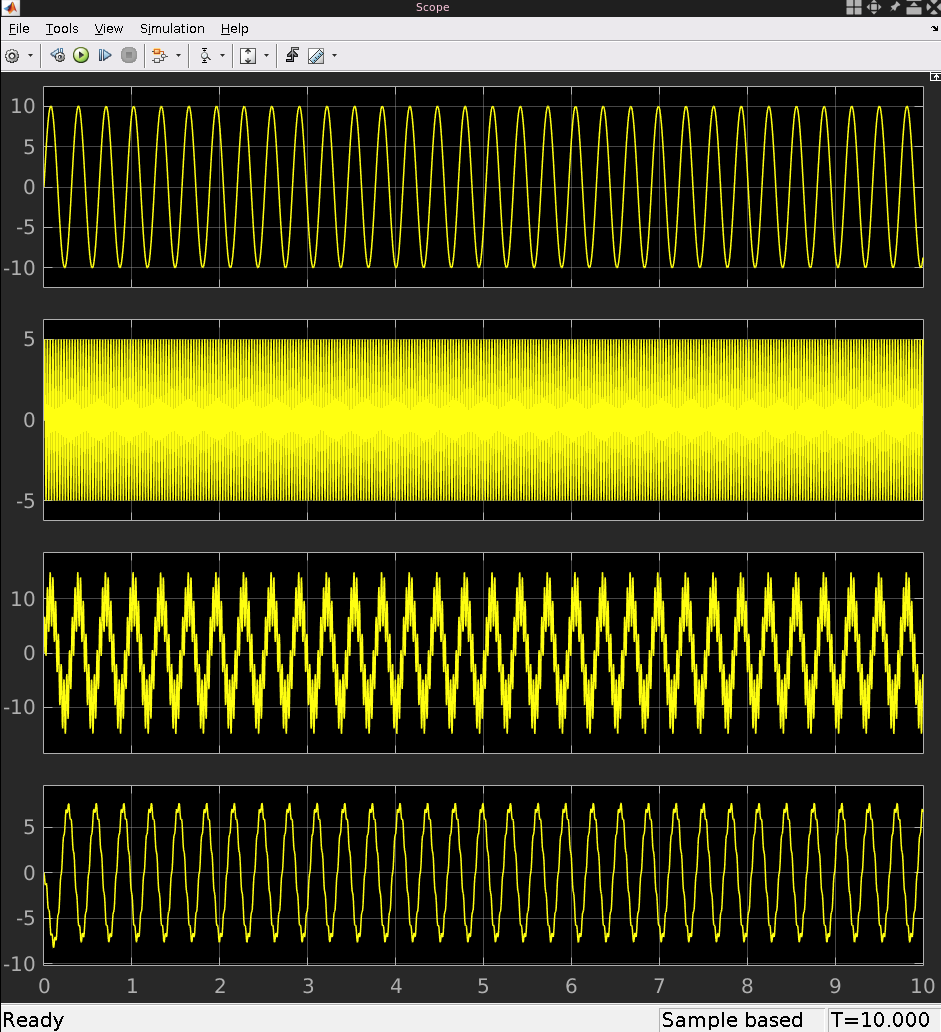
Here I have chosen a value of 220 Ohm for R and 300uF for C. The input signal has a frequency of 10 Hz with an amplitude of 10. The high frequency signal functions as noise and has a frequency of 10x the input frequency and half the amplitude of the input frequency. The result is as follows:

low pass scope

You can see that the low-pass filter works by filtering out the high frequency noise in the input signal. It is not perfect, as the output signal does not 100% represent the input signal, but it serves as a demonstration purpose

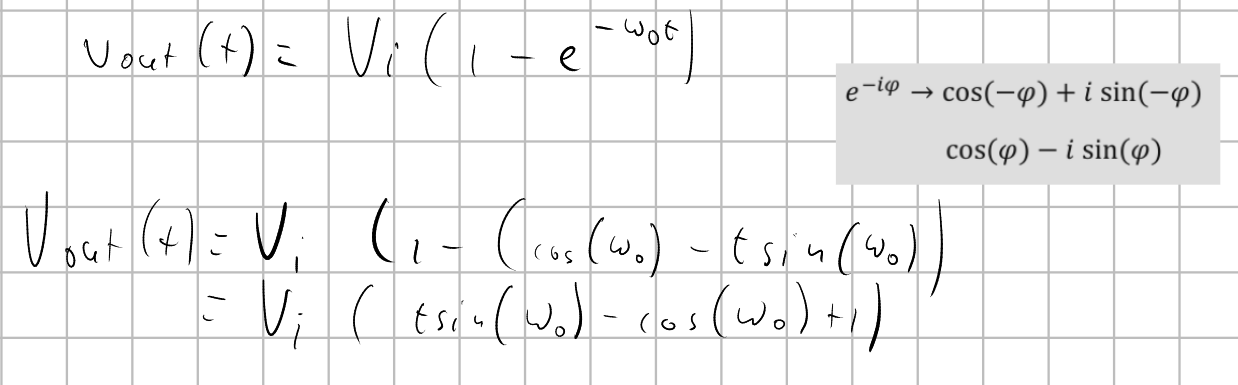
The step impulse equation can be rewritten using equation 1.18 on page 17 from Paul A. Lynn's book to the form:

step impulse response rewritten

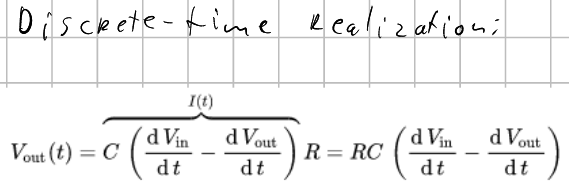
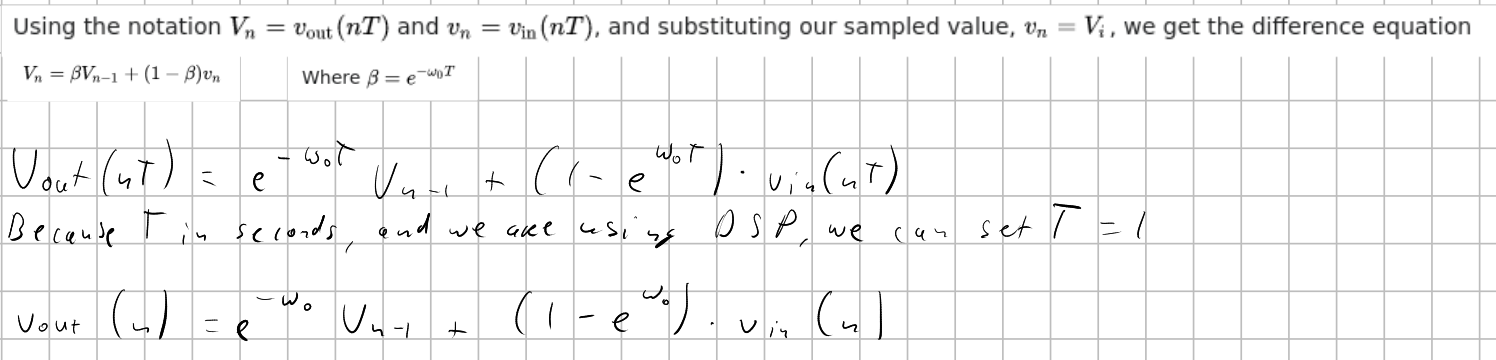
If we again look at the wikipedia article for low-pass filters, we can look at the difference equation through discrete time sampling. If we use that formula and use the fact that we are working with DSP signals and can omit the T variable (as said in the article about the simplest low-pass filter), we can get a new equation for the low-pass filter:

difference equation for low pass filter through discrete time sampling

In this equation, the w0 is the cutoff frequency, described by 1/RC. The next problem to solve is figuring out how we can set the value of a gain block in Simulink to exp(1/RC). There is some useful information about the gain block itself here, but it doesn't tell us how we can use an input for a gain block to set its value. This video contains some information about base and model workspaces. In the MATLAB workspace, I made two values for R and C, and defined a variable w0 = 1/(R*C). For testing, I set the value for R to 220 Ohm and C to 4.7 uF. However, when I wanted to set the gain value to the w0 variable, I got this error:

Error message when entering gain value

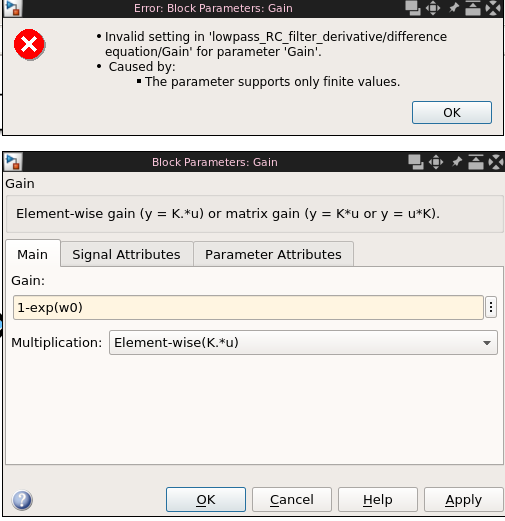
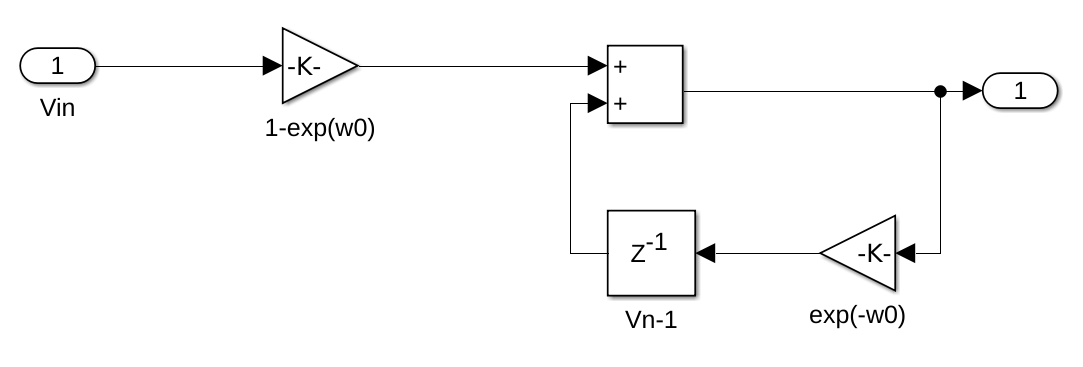
The problem was that the value of w0 was way too big. It was 1/(220 * 4.7-6), which is 967.1180. Because of this, the value for e-w0 was basically 0. To fix this, I changed C to 0.022, which changed w0 to 0.2066. After that, setting the gain value worked. I implemented the difference equation in a simulink model:

difference equation subsystem

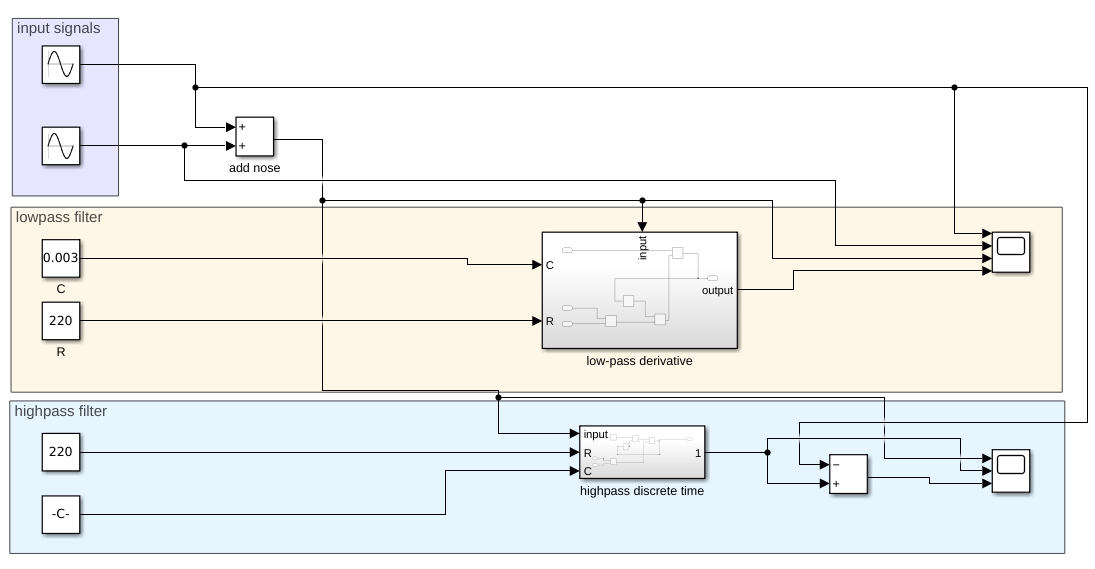
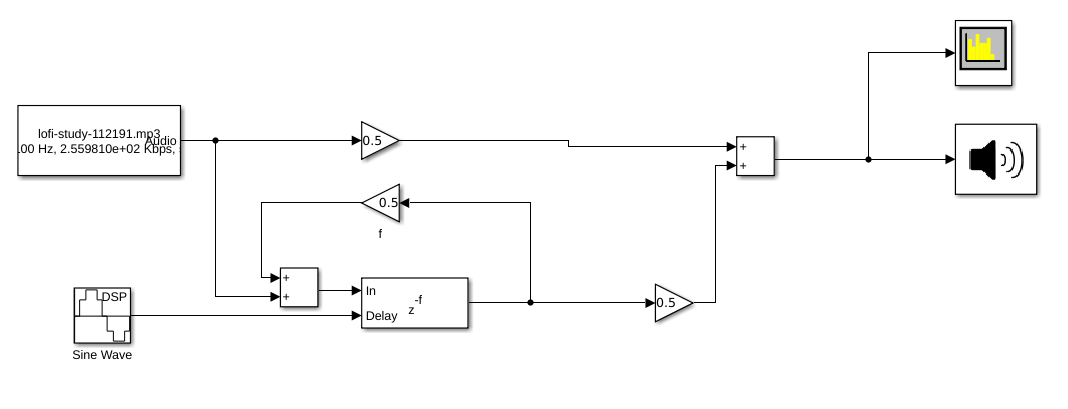
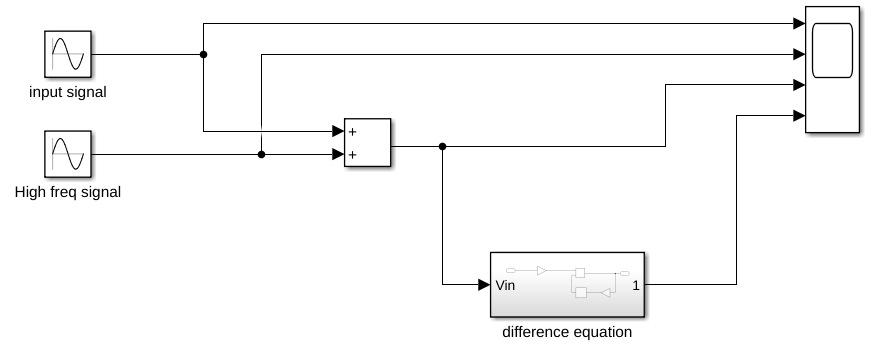
Using this subsystem, I added this into the model:

system with new subsystem

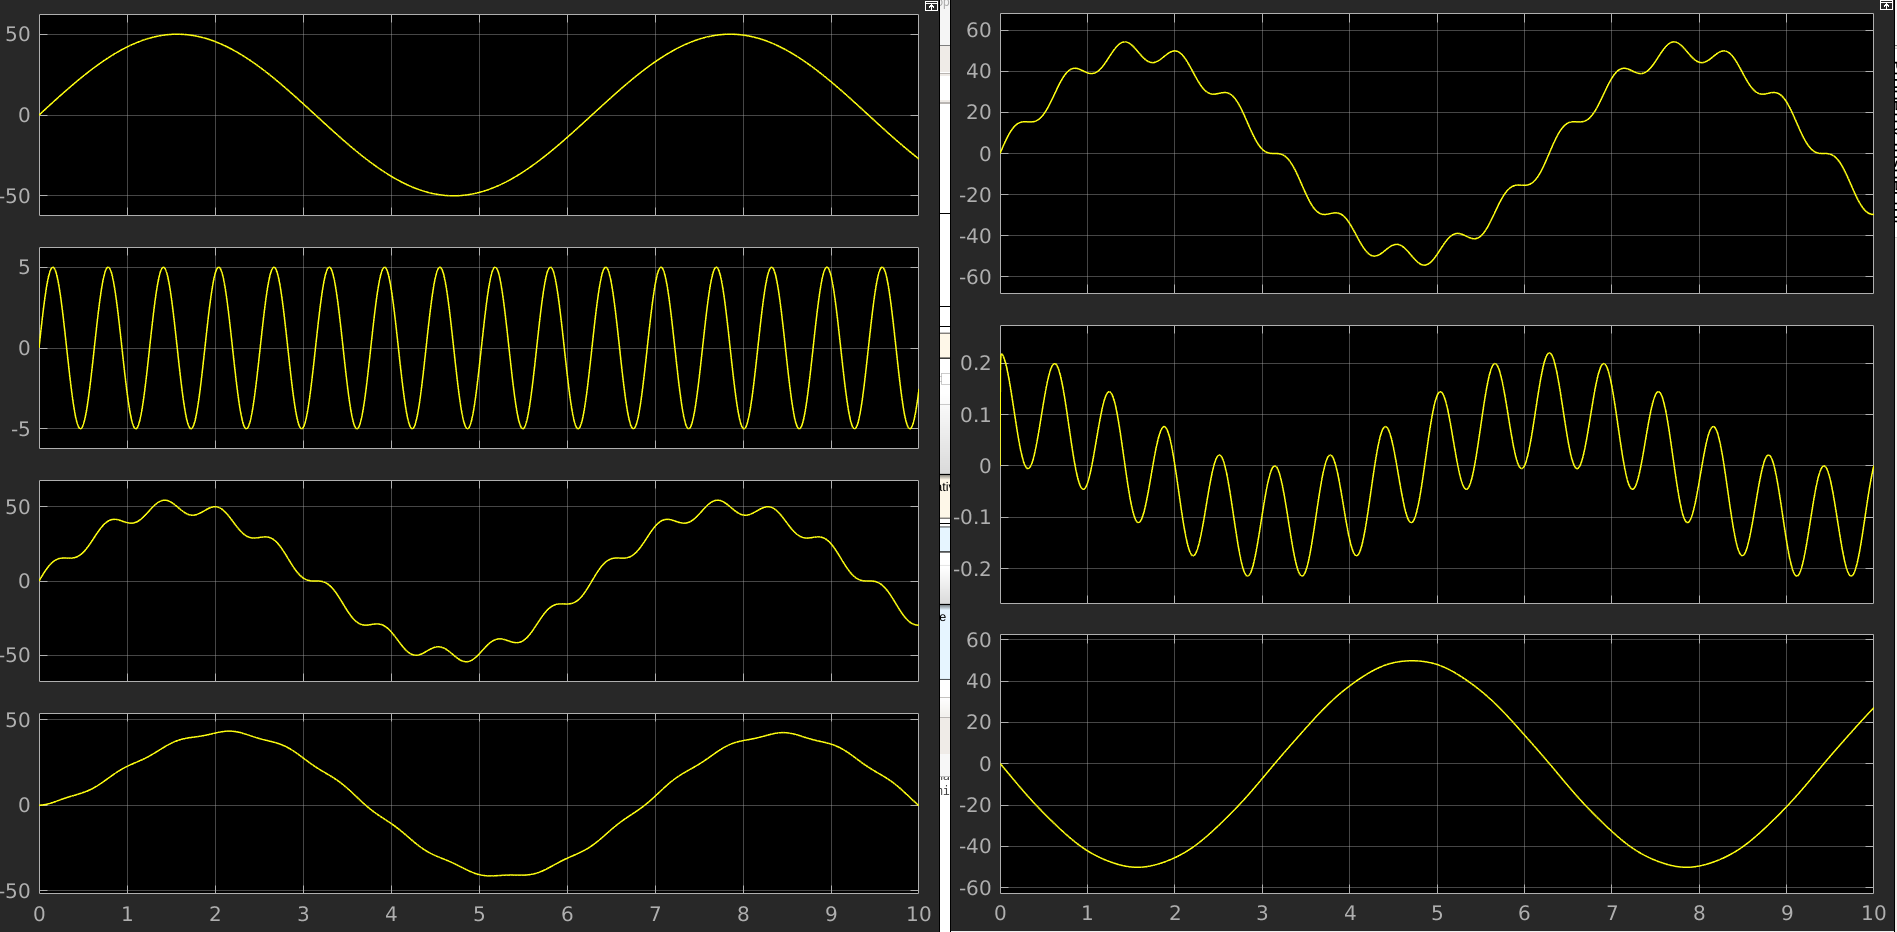
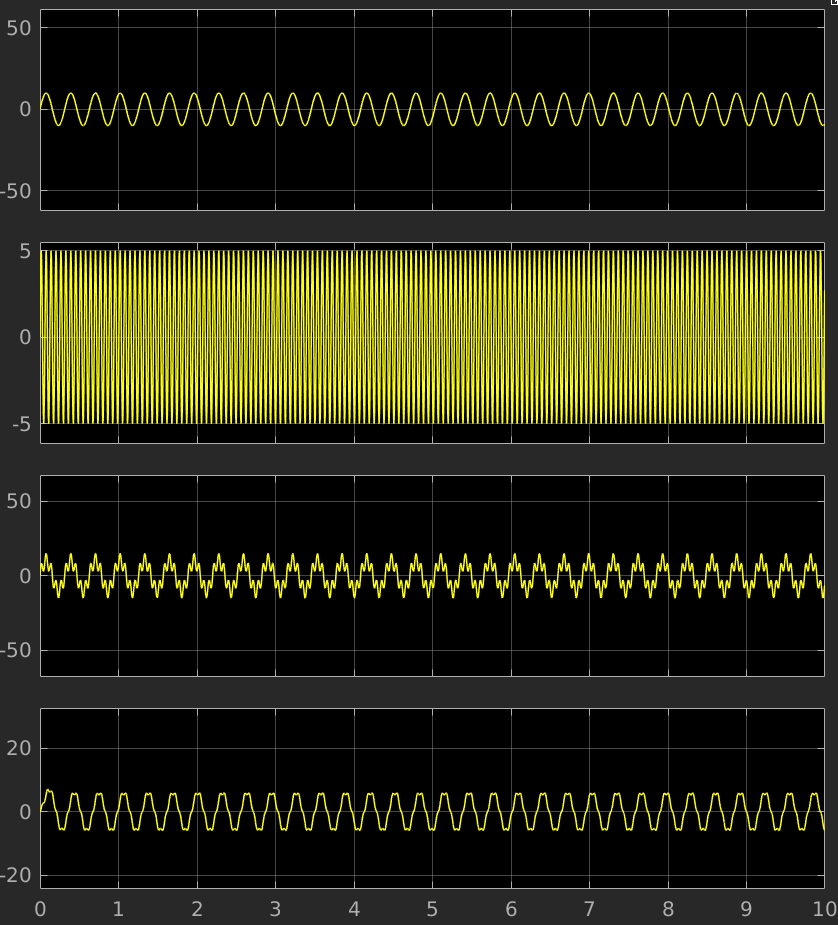
After that, I ran the model, and got the following result:

scope of new system

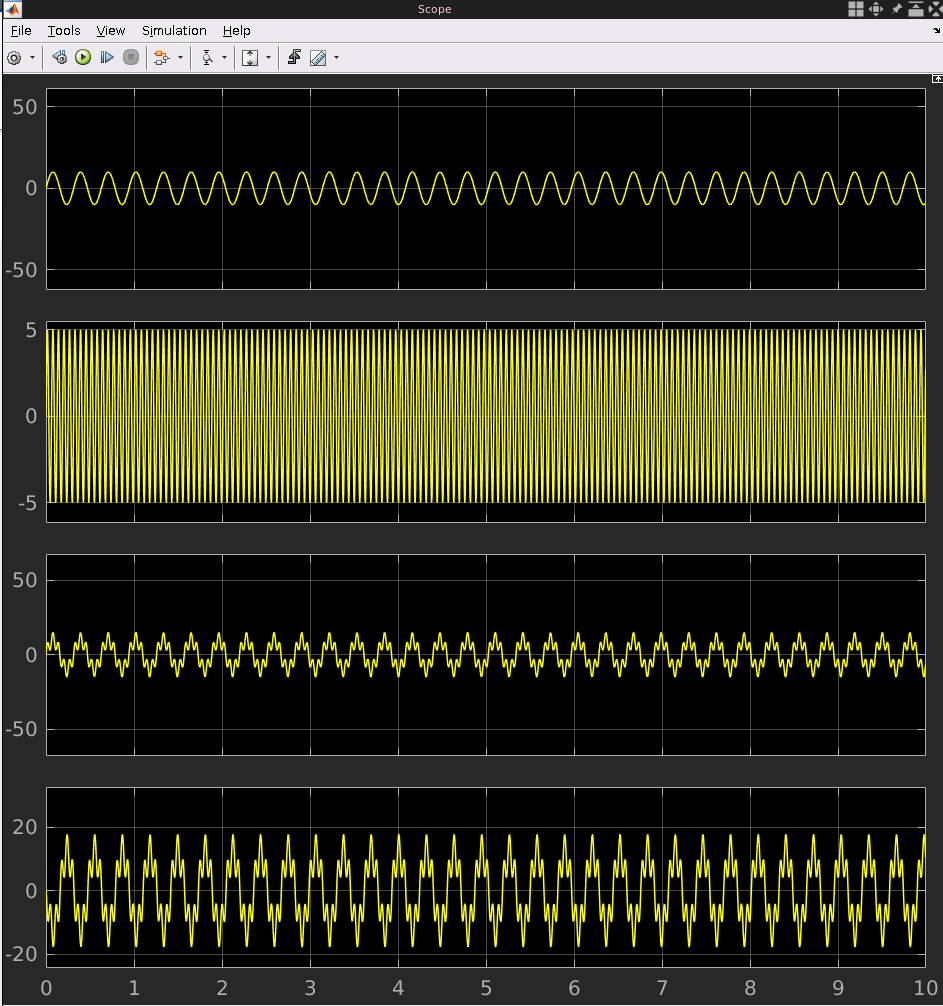
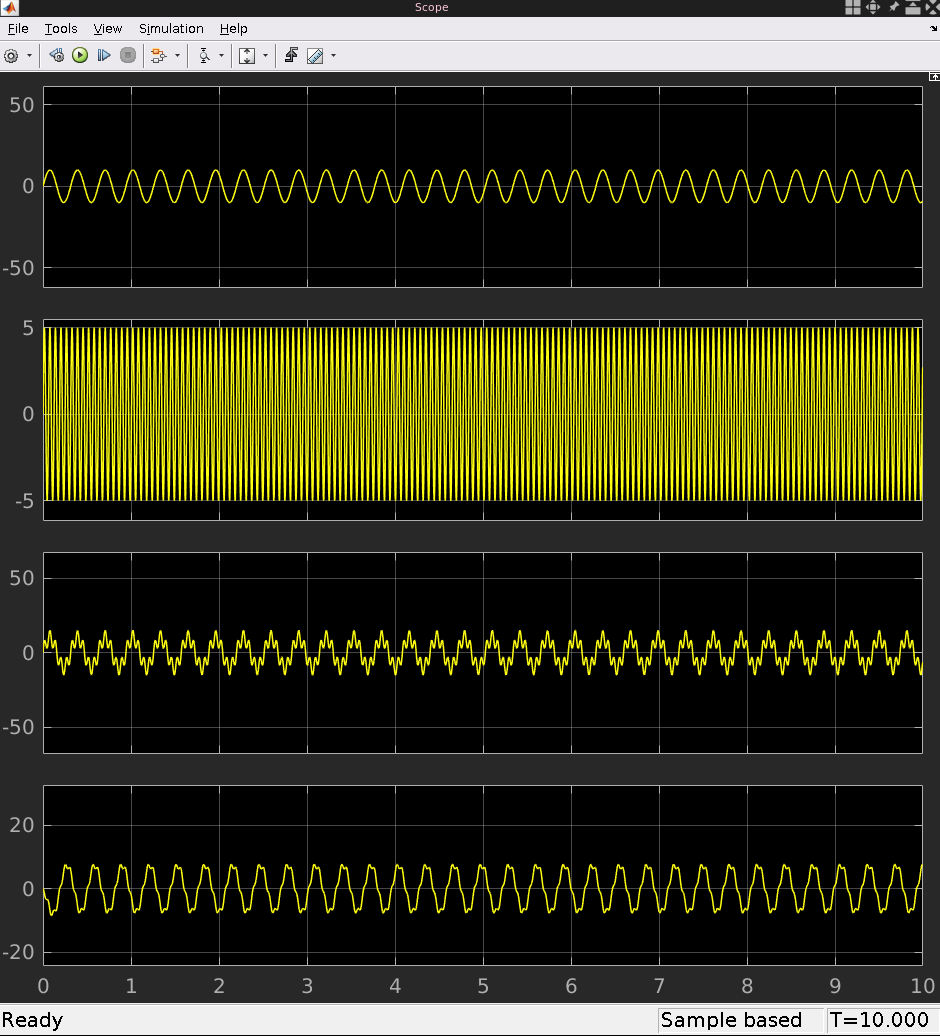
As you can see, the filter does not really work as expected, It seems to enhance the high frequencies instead of lower them. The problem is that the value of w0 is too high. If it's too close to 1, the filter won't do anything. So, I changed the value of w0 to 0.02066 to see how that affected the result. As you can see, this result is more promising. I also readjusted the y-axis of the scope to better see the signal.

scope of system with new value of w0 scope of system with new value of w0, y-axis adjusted

The Simulink file for the models can be found here in the library

high pass filter speaker gif

High-pass filter

I made some notes about high pass filters while the firewall was down in which I did some research about high pass filters, and specifically active high pass filters. According to Wikipedia, the difference equation for a high-pass filter can be described as:

high pass difference equation

And the equation for the discrete-time realization can be described as:

highpass discrete time realization

In a high-pass filter, the cutoff frequency is given by the formula fc = 1 / (2*pi*R*C), with R being the resistor value and C being the capacitor value. This video explains a lot about how to implement a highpass RC filter in simulink. The differential equation model is the same as for the lowpass filter:

highpass rc filter model

And the model for the discrete time realization can be made into something like this:

highpass discrete time filter model

To check if the highpass filter works, and to see the difference of the effects between a highpass and a lowpass filter, I made a Simulink model with both the higpass and lowpass filters implemented. The input signal has an amplitude of 50 and a frequency of 1 rad/sec. The 'noise' has an amplitude of 5 and a frequency of 10 rad/sec. For the lowpass filter, I used the values R = 220 and C = 0.003 resulting in a cutoff frequency of fc = 1/ (220 * 0.003) = 1.51 Hz. For the high pass filter, I used the values R = 220 and C = 0.00001 resulting in a cutoff frequency of fc = 1/ (2 * pi * 220 * 0.00001) = 72.343 Hz.

model to check difference between lowpass and highpass filters

After running the simulation, the result was as follows:

scope output of difference between lowpass and highpass filters

The left scope is the result of the lowpass filter, and the right scope is the result of the higpass filter. In both scopes the bottom signal is the result, and the signal above that is the input signal. In the lowpass scope the top two signals are the input and the noise signal. You can see that both filters did their work. The highpass filter, however, still has a slight oscillation in the resulting signal. This could be negated by substracting the low frequency original signal from the resulting signal. However, you can see that the phase of the output signal is slightly shifted as a result of the filter operation, so just substracting it will not work. For example, I modified the model to substract the low frequency signal from the result:

lowpass highpass substract model

After I ran it, the result was as expected: not really useful. In the rightmost scope you can see the third row containing the output signal of the subtracted signal. You can see that it doesn't represent the filtered signal at all.

lowpass highpass substract scope

The problem here however, is that we aren't calculating the delay of the filter into the substraction. The thing we need is to substract the lowpass oscillation from the filter output that has the same delay as the filtered output. One way to do this, is to also pass the low frequency signal through the filter, to add the phase shift to it, and then substract it from the filtered signal. The model then becomes this:

model with proper substraction

Then, when we look at the result, we can see that we got the original high frequency signal without the oscillation

scope of signal with proper substraction

The Simulink file for the models can be found here in the library

speaker gif speaker gif

Butterworth filter

I found this video that explains the calculations of a butterworth filter. The workings of a butterworth filter are also explained in chapter 6.3.1 on page 176 of Paul A. Lynn's book. There's also some useful information about them on their wikipedia page. It's a type of signal processing filter designed to have a very flat frequency response in the passband. It's usually implemented with a lowpass or highpass filter as a basis (this is then called the prototype of the filter). This article on DSPRelated also explains some key concepts of the butterworth filter, and it also gives some calculation examples.

As stated in the article on DSPRelated, the amplitude response of a Butterworth filter can be described with the formula:

In this function, N is the desired order (number of poles). An example of a butterworth filter in MATLAB can be found Here on DSPRelated.

echo gif echo gif

Echo

I found this paper about analysing digital audio effects using simulink that explained the implementation of a simple Reverb filter in simulink. Their model was this:

simulink model of reverb

The paper also presented an improved model that does not have feedback:

reverb model improved

I implemented this model in simulink, and wrote the output to a file:

reverb model output in simulink

The original audio file is this:

Music by FASSounds from Pixabay

And the audio passed through the filter is this:

The MATLAB file for this system can be found here in the Library.

guitar gif guitar gif cool

Flanger

I found this paper that talks about audio effects in digital systems, and it includes some useful information about flanger. They impose the following model for a flanger filter, using an LFO:

flanger filter model

They also provide a Simulink model for a flanger filter:

flanger filter model simulink

I implemented this model myself in Simulink, and tried to play the audio file so that I could hear the effect. Sadly, I got an error regarding the sampling rate of the LFO signal.

flanger model with audio sink

The paper also presented a version of a Flanger filter model that uses a feedback gain f. This gain controls how much of the signal is fed back.

flanger model with feedback

I implemented this in the Flanger model I made in Simulink:

flanger feedback model

The Simulink file can be found here. You can delete the audio device writer to make the simulation run.